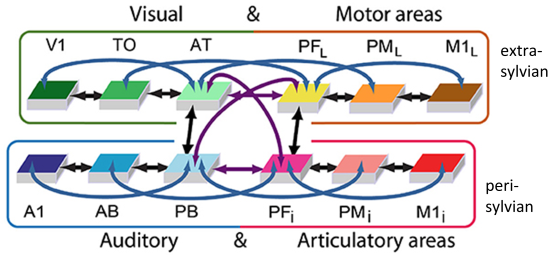
This is an interactive version of Fig. 3 in the paper entitled "Modelling concrete and abstract concepts using brain-constrained deep neural networks". You can view the cell assembly (CA) data for each individual concept that was used in the simulations. The top 3 rows show instance-CAs, whereas the bottom row shows an overlay of the entire concept-CA. In each row, the 12 areas are arranged in the same way as in Fig 2A/B of the paper (i.e., extra-sylvian areas on top, peri-sylvian areas on the bottom). The 4 central "hub" areas are shown as closer together because these areas are particularly strongly linked to each other (see Fig. 2A/B in the paper).
For further details, please consult the published paper here.
The raw data is available at Open Science Framework.
Adapted from Henningsen-Schomers & Pulvermüller (2021) Modelling concrete and abstract concepts using brain-constrained deep neural networks, https://doi.org/10.1007/s00426-021-01591-6, published under a CC-BY-4.0 license.
V1
TO
AT
PF_L
PM_L
M1_L
A1
AB
PB
PF_i
PM_i
M1_i
V1
TO
AT
PF_L
PM_L
M1_L
A1
AB
PB
PF_i
PM_i
M1_i
V1
TO
AT
PF_L
PM_L
M1_L
A1
AB
PB
PF_i
PM_i
M1_i
V1
TO
AT
PF_L
PM_L
M1_L
A1
AB
PB
PF_i
PM_i
M1_i
V1
TO
AT
PF_L
PM_L
M1_L
A1
AB
PB
PF_i
PM_i
M1_i
V1
TO
AT
PF_L
PM_L
M1_L
A1
AB
PB
PF_i
PM_i
M1_i